First, to create two tables and insert some testing data.
-------------------------------------------------
--
Script 1 - Create testing table first.
-------------------------------------------------
USE SSISDemoDB
GO
SET NOCOUNT ON
GO
IF OBJECT_ID('DeadLockTable1') IS NOT NULL
DROP TABLE
DeadLockTable1
IF OBJECT_ID('DeadLockTable2') IS NOT NULL
DROP TABLE
DeadLockTable2
GO
CREATE TABLE
DeadLockTable1
(
ID INT IDENTITY(1,1) PRIMARY KEY,
NAME VARCHAR(50)
)
CREATE TABLE
DeadLockTable2
(
ID INT IDENTITY(1,1) PRIMARY KEY,
NAME VARCHAR(50)
)
GO
--
Insert some testing data
INSERT INTO
DeadLockTable1
SELECT NAME
FROM sys.objects
INSERT INTO
DeadLockTable2
SELECT NAME
FROM
sys.objects
Run this script to create tables and data.
Second, to create two trasactions in two scripts, don't execute it when you finish it.
------------------------------------
--
Script 2
------------------------------------
USE SSISDemoDB
Go
BEGIN TRANSACTION
-- Update table 1
first
UPDATE
DeadLockTable1
SET NAME = 'Test1'
WHERE ID > 0
-- Pause 5 seconds
WAITFOR DELAY '00:00:05'
-- Update table 2
UPDATE
DeadLockTable2
SET NAME = 'Test2'
WHERE ID > 0
COMMIT TRANSACTION
GO
----------------------------------------
--
Script 3
----------------------------------------
USE SSISDemoDB
Go
BEGIN TRANSACTION
-- Updata table 2
UPDATE
DeadLockTable2
SET NAME = 'Test2'
WHERE ID > 0
-- Pause 5 seconds
WAITFOR DELAY '00:00:05'
-- Update table 1
UPDATE
DeadLockTable1
SET NAME = 'Test1'
WHERE ID > 0
COMMIT TRANSACTION
GO
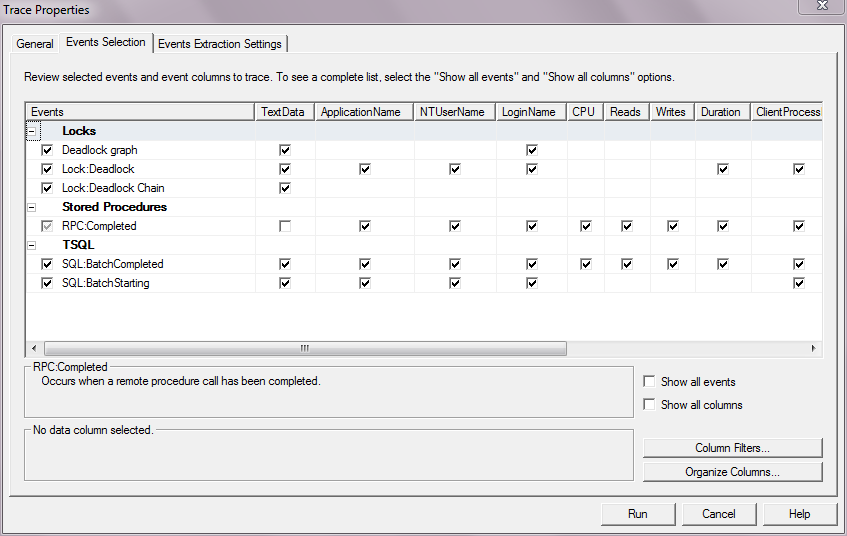
Third, open SQL Profiler and new a trace You can output the trace to a file or save data into a table.

We need to add some event for this trace, make sure the below event you have selected.
Deadlock Graph
Lock:Deadlock
Lock:Deadlock Chain
RPC:Completed
SQL:BatchCompleted
SQL:BatchStarting
Execute Script 2 and Script 3.
After 5 seconds, the message from script 2 show successfully updated information.
But script 3 return an error information -
Msg 1205, Level 13, State 51, Line 13
Transaction (Process ID 63) was deadlocked on lock resources with another process and has been chosen as the deadlock victim. Rerun the transaction.
In this case, there's a Deadlock caused by your query.
Find the Deadlock Graph on Profiler and you can see a query flow which can reflect the reason of the Deadlock and system end the left trasaction and keep the right one.


It helps us know which statements caused the Deadlock and we need to analyze the reason and tune our scripts. The Deadlock wouldn't impact the process, because SQL Server will choose a connection to end it.
Before the application go live, we may use SQL Profiler to trace the performance and check if there's any Deadlock in system. You can save the trace information into a table and use SSIS Package or SQL Job to inform team there's something unexpected in our system.

No comments:
Post a Comment